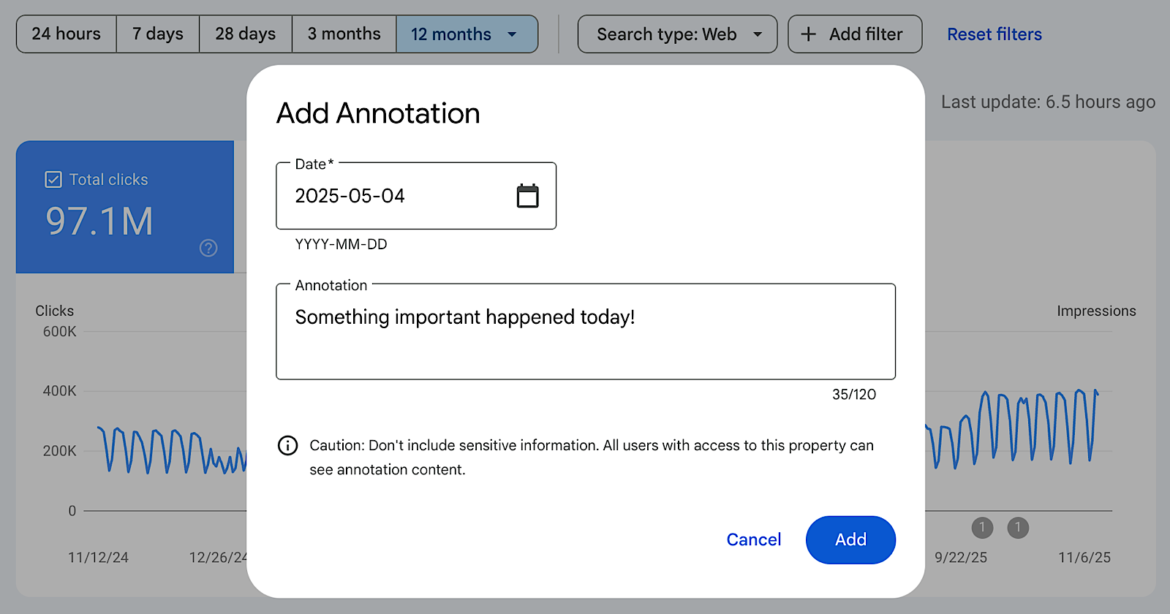
Google Search Console now includes a new feature that allows users to add custom annotations to performance charts, making it easier to track when updates or outside events influence search data.
Search Console Adds Custom Annotations
Google has rolled out the ability to insert custom notes directly into performance reports in Search Console. These annotations can be placed on specific dates to explain site changes, updates, or external factors that may have affected your traffic.
What This Feature Does
Annotations appear as markers on your Search Console charts. Google notes that they’re useful for logging things like:
- Technical updates or infrastructure changes
- SEO improvements or fixes
- Content updates or strategy shifts
- External influences such as holidays or market events
Since all annotations are visible to everyone with property access, Google advises against including personal or sensitive information.
Why It’s Helpful
Understanding why traffic rises or falls can be difficult, especially when changes were made weeks or months earlier. Previously, this required keeping notes in separate documents or spreadsheets.
With annotations built into Search Console, you get a centralized log of updates right inside the charts you already use. This is especially valuable for teams or agencies managing multiple websites, as it provides a shared timeline of releases, migrations, and campaigns.
How to Add Annotations
To create an annotation, simply right-click on any performance chart and select “Add annotation.” Choose the date you want to mark and enter up to 120 characters of text. The annotation then appears directly on the chart, alongside metrics like clicks and impressions.
Google has now fully integrated custom annotations into Search Console performance reporting, accessible through each chart’s context menu.

